Subscribe to our research releases
Subscribe to stay in touch with our latest insights, news and events on ....
The Playbook for Curating Liquidity in US Equity ATSs

1. Introduction
The original promise of Alternative Trading Systems (ATSs) was simple—two institutions wanting to trade the same stock in opposite directions could match anonymously at midpoint, avoiding market impact entirely. For a time, that promise held.
Then it broke.
As ATSs competed for market share, they opened their doors to increasingly diverse participants, including HFT market makers, proprietary trading firms, retail flow from wholesalers, and algorithmic conditionals. Volume grew. Fill rates improved. But so did two critical risks for institutional investors—adverse selection and information leakage.
Adverse selection occurs when an institutional order trades against a counterparty with superior information about imminent price movements, systematically buying before prices fall or selling before prices rise. Information leakage happens when trading activity signals an institution's intentions to other participants, who then trade ahead of the remaining order flow. Both erode execution quality, and both become more likely as counterparty diversity increases.
These risks are related but distinct. Adverse selection is about the trade just made—a trader bought, then prices fell because the counterparty knew something they did not. Information leakage is about the trades not made yet—others detected the trader’s buying interest and prices rise before their order is complete. One costs the fill that was received; the other costs the fills still to come.
ATSs responded to these issues with segmentation, dividing their pools into sub-venues and letting participants choose which segments they are willing to trade against. But segmentation schemes vary wildly across venues and the details of the methodologies are buried in dense ATS-N filings. This leaves a fundamental question unresolved…does segmentation actually reduce adverse selection and information leakage?
In this research paper, we answer that question and go beyond segmentation to answer a bigger question—the most important question of all. How can institutions get the dark liquidity they need in a fragmented market while avoiding the challenges that increase their execution costs?
To these ends, we analyze the full spectrum of ATS segmentation approaches, present original data on their effectiveness, and introduce liquidity curation methods that go beyond what ATSs offer. We conclude with a practical playbook for measuring, monitoring, and adapting execution approaches as conditions change.
The framework in this paper is the framework behind Curator, our dark liquidity aggregation algorithm. We built Curator around a simple premise: the industry has largely solved for fragmentation, but it has not solved for curation. Most execution algorithms can access most ATSs, but connecting to a venue is not the same as knowing how to use it. Which segments to access, which tactics to deploy, when to provide versus take, how to handle conditionals, and when to let signals override default behavior are all important decisions, and these decisions compound. Most algorithms treat them as an afterthought or not at all. In building Curator, we learned that liquidity curation is the edge, not just liquidity access. Everything in this paper reflects how we think about the problem and how Curator operates.
In addition, fragmentation has not fully been addressed. Private pools and certain buy-side-only segments remain inaccessible to most execution algorithms. We have developed a broker-neutral approach that allows buy-side firms to access these pools directly through Curator, provided they are willing to disclose their identity to the pool operator. This unlocks liquidity that would otherwise require using multiple brokers' algorithms or giving up access entirely.
This paper will address tactical execution questions around firm orders only, which are multifaceted and complex. Conditional orders are a second, critically important piece of the dark liquidity curation puzzle. Conditional orders follow their own unique rules and require distinctive consideration around adverse selection and information leakage as a result. For example, while conditional orders do not result in immediate executions and thereby avoid some of the toxicity firm orders may be exposed to, their structure of generating potential invitations a trader can decline creates an even larger risk of information leakage. A second paper will be released shortly after this one to focus strictly on conditional orders. It will cover the mechanics, benefits, and drawbacks of conditional orders, as well as how to ensure they contribute meaningfully to (and do not detract from) execution quality.
The days of simple block crossing are over. Navigating today's ATSs requires understanding the fifty shades of grey between "toxic" and "non-toxic" dark liquidity.
2. Understanding ATS Segmentation
2.1 The Counterparty Landscape
Modern ATSs aggregate flow from participants that would never have interacted in the original block-crossing model. Table 1 below shows each counterparty type along with their execution objectives and toxicity profile.
The toxicity profile of the counterparties institutional traders interact with matters a great deal. When providing liquidity, they should aim to interact with counterparties listed near the top of Table 1 and avoid those near the bottom. Segmentation is one method for achieving this style of counterparty selection.
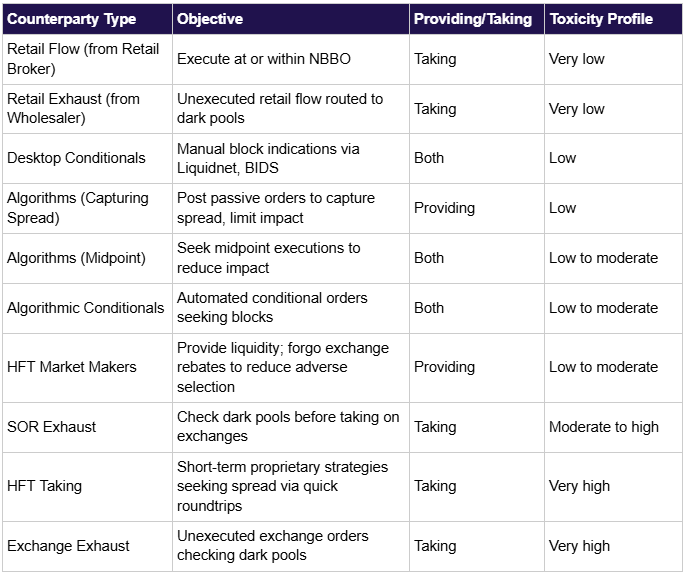
Table 1. List of market participants present in ATSs along with their objectives, typical action, and level of toxicity. Those institutional traders providing liquidity should aim to interact with those counterparties listed near the top (least toxic) and avoid those listed near the bottom (most toxic).
2.2 How Segmentation Works
Segmentation is the ability to interact with a defined subset of counterparties rather than the full pool of participants in an ATS. Each ATS has developed its own approach to segmentation, detailed in its ATS-N filing; there is no industry standard for this practice. Broadly, ATSs tend to fall into three categories:
- Markout-based classification: A quantitative approach that categorizes liquidity takers by the adverse selection experienced by liquidity-providing participants trading against them
- Counterparty-based classification: A qualitative approach classifying participants by their institutional identity (e.g., retail, buy-side, broker-dealer, etc.)
- Some ATSs offer an approach that is a combination of types 1 & 2
2.3 Adverse Selection and How It Is Measured
Adverse selection occurs when informed counterparties systematically trade against an order before prices improve for it. A trader is selling, a counterparty buys, and then the price rises, for example. Consistent occurrence of this pattern—one in which there are better prices available immediately after a trade—transfers wealth from the trader to the informed counterparty.
The standard metric for measurement of adverse selection is the markout—the price movement following a trade, measured at specific time intervals and expressed as a percentage of the bid-ask spread. Negative markouts indicate adverse selection, while a markout of zero indicates random price movement post-trade—no adverse selection on average. Negative adverse selection (positive markouts) is not a realistic outcome to aspire to. Even the least toxic order flow (for example, retail) is considered to be random at best, so it is unlikely that a liquidity provider experiences a positive markout after execution. If experiencing a positive markout on liquidity providing orders, it likely means there is insufficient data for statistical significance.
Throughout this paper, we measure adverse selection using two types of markouts:
- Mid-to-mid markouts—the change in midpoint price from execution to a time afterward
- Execution markouts—the difference between the price at execution and the midpoint price at a time afterward
Mid-to-mid markouts measure a pure post-trade price change, while execution markouts measure the post-trade price change net any spread earned that offsets adverse price change.
Tolerance for adverse selection depends on the price at which a trader provides liquidity. Posting at the midpoint price earns no spread, so any adverse selection is experienced as cost. Alternatively, posting at the near price captures spread, which means it can absorb some adverse selection before becoming a net loss. A 10% mid-to-mid markout at midpoint is roughly equivalent in cost to a 60% markout at the near price. This tradeoff becomes central in Section 3.
Finally, the measurement time horizon of markouts matters a great deal. Short-term markouts capture immediate adverse selection from high-frequency counterparties. Longer-term markouts capture information that takes longer to be reflected in prices. Measuring markouts over too short a period can fail to incorporate the post-trade price change in full, while measuring over too long a period can incorporate noise related to other market-moving factors. In our experience, markouts continue to worsen until approximately 10 seconds post-trade, when the effect tends to saturate.
2.4 Markout-Based Segmentation
In markout-based segmentation schemas, venues classify a counterparty's liquidity-taking flow into grades of toxicity based on the markouts experienced by providers trading against it. Liquidity providers can then choose which grades they are willing to interact with.
Most major bank-operated ATSs now offer some form of markout-based segmentation, typically with three to five tiers. Goldman Sachs's Sigma X is a useful example. Sigma X categorizes liquidity-taking flow into three tiers: Tier A (most favorable for providers), Tier B (medium), and Tier C (least favorable, highest adverse selection). Providers can configure their preferences: A only, A and B, or all tiers.
Goldman Sachs publishes periodic markout reports showing differences of 25 to 35 percentage points of spread between Tier A and Tier C. Choosing Tier A only represents a substantial difference in execution quality, on average, in their sample.
However, published markouts require careful interpretation. They represent collective markouts across all participants, including high-frequency market makers who use proprietary signals to cancel orders when conditions turn negative. HFT markouts will be better than those of institutional algorithms, which cannot cancel as frequently because their objective is order completion, not just spread collection.
The higher the ratio of HFT executions in the published sample, the less reliable those numbers are for predicting a trader’s own experience. As a result, algorithmic execution brokers must measure markouts independently to build proprietary intelligence about true expected execution quality against each segment.
Other venues using markout-based segmentation include Virtu MatchIT (five tiers), UBS ATS (three tiers), Barclays LX (three tiers), Citi-One (five tiers), and Instinet CBX (three tiers). Each operator uses distinct nomenclature ("alpha," "reversion," "quality") to designate tier quality.
2.5 Counterparty-Based Segmentation
Counterparty-based segmentation classifies participants by institutional identity rather than measured trading outcomes. One challenge is that these classifications vary across venues. One ATS may offer retail, buy-side, and sell-side categories, for example, while another may distinguish sell-side DMA from sell-side algorithmic, or break out buy-side HFT from buy-side asset managers. Table 1 in Section 2.1 serves as a useful starting point for expected toxicity among counterparties, based on our experience.
This approach is not markout-focused, and ATSs rarely publish markout data for these segments. Evaluating them requires careful review of ATS-N filings, interviews with operators (though most will not go beyond what is published in their filing), and market structure knowledge.
JPM-X is a good example of counterparty-based segmentation. It offers five classifications:
- Tier 1: JPM institutional investor and broker-dealer client flow using JPM algorithms
- Tier 2: Institutional investor and non-US broker-dealer directed flow
- Tier 3: Principal flow from JPM and affiliates
- Tier 4: US broker-dealer directed agency flow
- Tier 5: US broker-dealer directed principal flow
These hierarchies are useful guides, but must be verified with data. Not all institutional flow has the same toxicity, and how firms are categorized as "buy-side" varies by ATS. Just as in the case of markout-based segmentation, execution brokers must maintain proprietary analytics to fine-tune segmentation decisions.
2.6 Private Pools
Some ATSs operate private pools—segments created for a specific broker-dealer where only that dealer can send orders. Broker-dealers use these to cross their customers' buy and sell flow before exposing orders to other venues, reducing explicit costs and maintaining better control over toxicity.
Level ATS, OneChronos, and Intelligent Cross offer this functionality for broker-dealers who do not operate their own ATS.
Unlike traditional segmentation, participants cannot request access to another dealer's private pool. By design, that liquidity is restricted. This is one of the problems Curator was built to solve. When buy-side firms are willing to disclose their identity to a private pool operator, Curator can route directly to those pools on their behalf, aggregating liquidity that would otherwise be inaccessible within their overarching algorithmic execution strategy.
2.7 Which Segments Can You Access?
Not every participant can access every segment, and this is where the complexity of segmentation resides. Access rules differ by segmentation type, and the details matter more than most realize.
Markout-based segmentation is the more democratic model of the two. Regardless of whether a participant is buy-side or sell-side, they can choose which liquidity-taking grades to interact with when they provide liquidity, assuming they are a direct subscriber to the ATS. Importantly, liquidity-providing flow is never rated. Only liquidity-taking flow receives a tier classification. A broker whose taking flow is rated Tier B at Sigma X can still choose to interact only with Tier A takers when providing.
But there is a catch. Though a participant's taking-flow rating does not limit their choices, it still affects the likelihood others will choose to exclude them. A poor rating means many providers will exclude a participant’s taking flow, reducing their fill rates on IOC orders. In addition, if a broker represents toxic clients (sponsored access, for example), their overall rating will reflect it. Other non-toxic buy-side clients of the broker will also inherit the broker's flow rating, and may suffer exclusion as a result.
Counterparty-based segmentation schemas can also be limiting for buy-side firms trading through broker-dealers because of the classification they are put under. However, in this case, it applies to both taking and providing order flow; recall that for markout-based segmentation, it only applies to order flow taking liquidity.
Consider JPM-X, for example, though many pools have similar tiering structures (e.g., UBS, Level, BAML). Their five tiers place JPM institutional and broker-dealer client flow using JPM algorithms at the top (Tier 1), followed by institutional investor and non-US broker-dealer directed flow (Tier 2), then JPM principal flow (Tier 3), then US broker-dealer directed agency flow (Tier 4), and finally US broker-dealer directed principal flow at the bottom (Tier 5).
A US broker-dealer routing to JPM-X with their own algorithms or SOR is classified as Tier 4 or Tier 5 by definition. They cannot choose to exclude order flow from Tier 3 and below however a buy side firm routing flow directly will be classified as Tier 2 and can choose to exclude the order flow in Tier 3 and below.
This can create a real problem. A buy-side firm using a broker's algorithm to access JPM-X is classified based on the broker, not their own identity. The broker is Tier 4, and the buy-side firm's order sent via the broker will be treated as Tier 4 flow. The buy-side firm loses access to the segments for which their flow would otherwise qualify.
This is another problem we addressed when building Curator. When buy-side firms route through Curator, their orders can be tagged with their own identity rather than BestEx Research. For example, in the case above, they would be classified as Tier 2 at JPM-X rather than Tier 4. The same applies to private pools that restrict access to buy-side only. Without this approach, buy-side firms must either use multiple brokers' algorithms to access different pools or give up the ability to access this source of less-toxic liquidity entirely.
2.8 Does Segmentation Work?
Before answering this question, it is worth noting that segmentation is not the only protection venues offer. Some have built structural mechanisms into their matching engines—IEX's 350-microsecond speed bump and Crumbling Quote Indicator, NASDAQ's minimum resting time requirements (MELO), Morgan Stanley's restrictions on IOC flow, OneChronos's auction-based matching. These features reduce adverse selection independent of counterparty filtering. They are useful, but they are not configurable, so no decision is required in order to benefit. The curation decisions that matter are the ones that can be controlled.
Given this, does segmentation actually improve outcomes for investors? The short answer is yes, but there is nuance in the answer. The data tells a clear story, illustrated in Figure 1 below. Figure 1 shows that segmentation improves execution markouts (incorporating any spread earned by each execution) at every venue in the sample. But readers will notice the magnitude varies wildly.
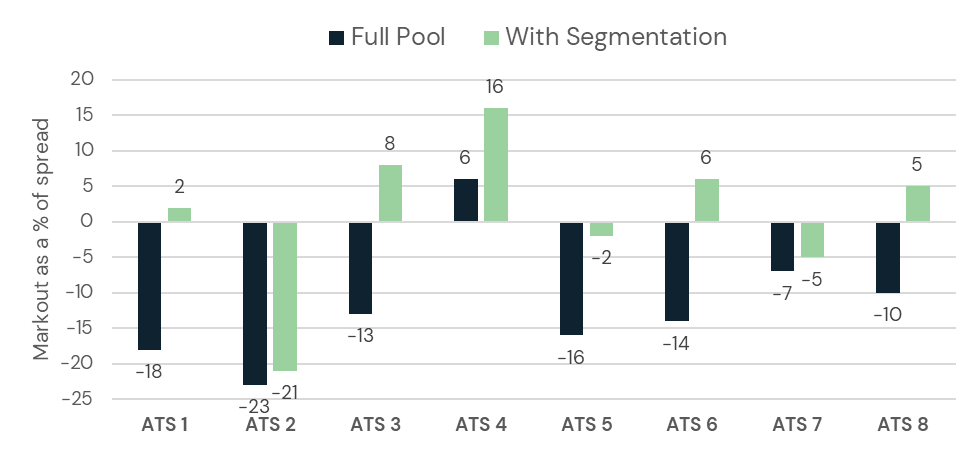
Figure 1. Execution markouts for orders posted at the near price as a percent of spread for full pool (navy) versus the most restrictive tier (green) across eight major ATSs.
In ATS 3, for example, accessing the most restrictive tier improves over the full pool by 21 percentage points—from -13% in the full pool (navy) to +8% in the top tier (green). But ATS 2 improves by just 2 points when restricted to top tier liquidity, improving only from -23% to -21%. Some venues like ATS 4 show positive markouts even without segmentation (+6%), suggesting cleaner flow to start. Others, like ATS 2, remain deeply negative even with segmentation (-21%), suggesting structural toxicity that filtering cannot fully address.
Clearly, while segmentation does improve markouts, it is not equally effective everywhere. The difference between a 2-point improvement and a 21-point improvement is enormous. Blindly enabling "top tier only" across all venues ignores this nuance and may have unintended consequences.
In addition, cross-venue comparison also matters. ATS 4's unsegmented pool (+6%) outperforms ATS 2's top tier liquidity (-21%), underscoring that venue selection matters as much as segment selection.
In some cases, the right answer is not to segment at all. These findings underscore the reality that a measured approach to fill quality judgments matter more than the ATS-N filings, though they can be key to understanding quality as well.
While Figure 1 illustrates improved markouts at some venues when accessing the least toxic segments, those improved markouts come at a cost. Restricting interaction to higher-quality tiers means trading against a smaller subset of flow, which reduces fill rates. Figure 2 illustrates the reduction in fill rates experienced when restricting to top tier liquidity only, corresponding to Figure 1. Figure 2 clearly shows that limiting to the highest-quality liquidity offered by an ATS dramatically reduces the fill rate experienced.
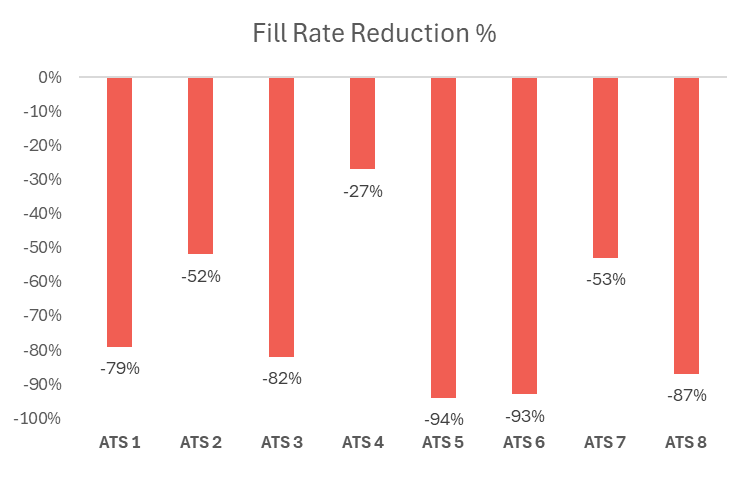
Figure 2. Fill rate reduction when accessing the most restrictive tier of an ATS versus the entire pool. Figure 2’s sample corresponds with that of Figure 1. For example, while ATS 3 improves markouts from -13% to 8% in its most restrictive tier versus the entire pool (Figure 1), the restriction reduces the fill rate of child orders by 82% (Figure 2). Understanding Figure 1 and Figure 2 in concert is critical to optimal use of ATS-sponsored segmentation.
A trader’s goal is not always optimized markouts; it is to optimize performance given a parent order’s size and urgency. Some orders cannot afford the fill rate reductions illustrated in Figure 2, and in some cases, high-quality executions do not require restriction at all, as discussed above.
This is how we think about Curator. It is not simply a standalone dark liquidity aggregation algorithm but a liquidity curation layer that stands alone and operates inside all of our execution algorithms—VWAP, IS Zero, Liquidity Seeking. The tradeoffs it makes depend on the urgency of the parent algorithm.
In summary, ATS-sponsored segmentation is a tool, not a complete solution. There is real work required to determine when and how it can be best leveraged to deliver the desired outcomes—which can vary significantly according to the trader’s order flow. In addition, there is much more an execution algorithm can do to reduce adverse selection and information leakage. We will turn our attention to those aspects of Curator’s design and how they layer with segmentation to improve outcomes.
3. Segmentation Using Tactics
As illustrated above, ATS segmentation helps, but it is not sufficient. When an order rests at midpoint, it does not capture spread. Every basis point of adverse selection experienced by the order, then, comes straight out of its execution quality. When resting at the near touch, an order captures the full spread; it can afford to absorb some adverse selection and still break even. Orders on the same market with the same counterparties—placed at different prices—have a completely different tolerance for toxicity.
But adverse selection is only half of the problem; information leakage is also a concern.
A large order resting at midpoint is a sitting target. Small pings are likely to find the order—100 shares here, 200 there. Each fill is harmless on its own. But each fill tells someone you are there. And in our estimate, almost 80% of order flow in ATSs is destined for exchanges; the pings are not patient institutional counterparties looking for blocks. These are SORs checking the dark before sweeping the lit market. They ping a resting order, learn it exists, and move on. Now the market knows.
Worse, while the order rests, it is supporting the price. Its large resting bid prevents the price from falling. The resulting markouts will look fine, as the price will not move against the order after each fill. The true cost only reveals itself after the entire order completes and the price reverts, entirely missed by analysis of markouts.
While segmentation can address some fill quality issues, it cannot solve these problems. It can filter counterparties, but it cannot filter the physics of resting versus taking, or the math of spread capture at different price levels.
For these issues, tactic selection can help.
3.1 The Hunter and the Hunted
Every interaction in a dark pool has two sides—the order that was resting and the order that arrived. One is waiting while one is seeking, and this distinction matters more than most traders realize.
The choice to rest an order is a choice to be passive. The order waits for someone to find it, hoping to earn spread in exchange for giving up immediacy. Whoever finds the order made a decision—deciding to trade right now, at this price, and agreeing to pay a premium to do it. This decisive order is selecting the resting order.
On the other hand, in sending an IOC order, a trader is active. The trader is selecting whoever happens to be resting. The resting party did not choose this moment, the active trader did. The patient party is less likely to be informed, less likely to be toxic.
The core insight here is that toxicity comes from takers, not from providers. By choosing to take instead of provide, a trader chooses to interact only with the passive side. They become the hunter instead of the hunted.
This phenomenon is illustrated in Figure 3, showcasing that dark midpoint ping (IOC) orders significantly outperform dark midpoint post (DAY) orders in the adverse selection they experience (measured mid-to-mid). Though they are executed in the same venues at the same price, they experience completely different results. The only difference between these two types of order is who chose the moment of interaction—which counterparty is the hunter.
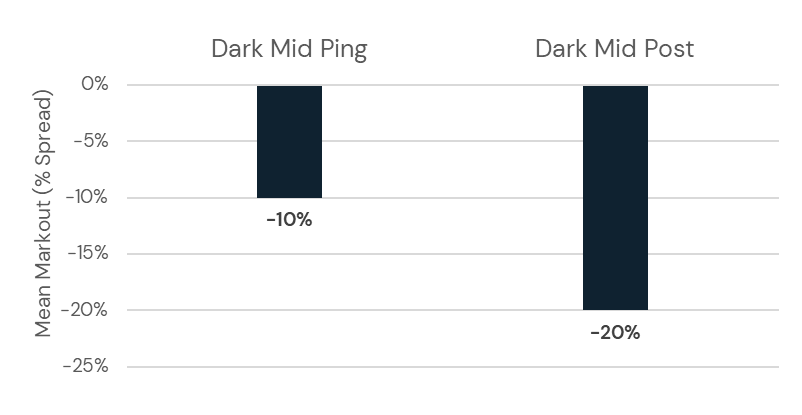
Figure 3. Mean mid-to-mid markout as a percent of spread for Dark Mid Ping versus Dark Mid Post child orders. Both order types execute at midpoint, but orders posted at midpoint experience substantially more adverse selection.
If a venue remains toxic even after segmentation, or if appropriate segmentation is not available, the solution may be to stop resting at this venue. Ping only. While the fill rate may decline a bit, the trader takes control of the resulting execution quality.
3.2 The Spread Capture Tradeoff
Unfortunately, an execution algorithm cannot only ping, as fill rates would collapse. Algorithms must provide liquidity at least some of the time…but at what price?
Providing liquidity at midpoint earns no spread, so any adverse selection is experienced as a pure cost. If an order’s markout is -20%, it lost 20% of spread with nothing to offset the loss
Contrarily, orders posted at the near touch earn the full spread. Adverse selection must exceed 50% before the order loses any money. A -40% markout on a near post order means a loss of 40% of spread, but the order earned 100% of the spread; it is still ahead by 60%.
As illustrated in Figure 4, near post orders typically generate worse markouts than mid post orders (shown as mid-to-mid markouts in Figure 4). This is to be expected; when interacting with counterparties willing to trade at the far side, typically exchange exhaust, more toxicity is likely. But the math can still work in the trader’s favor. The breakeven is a -50% markout for orders posted at the near price. Worse than that, and the order is losing money despite capturing spread. Better than that, and near posting becomes a profitable contributor to a parent order’s execution.
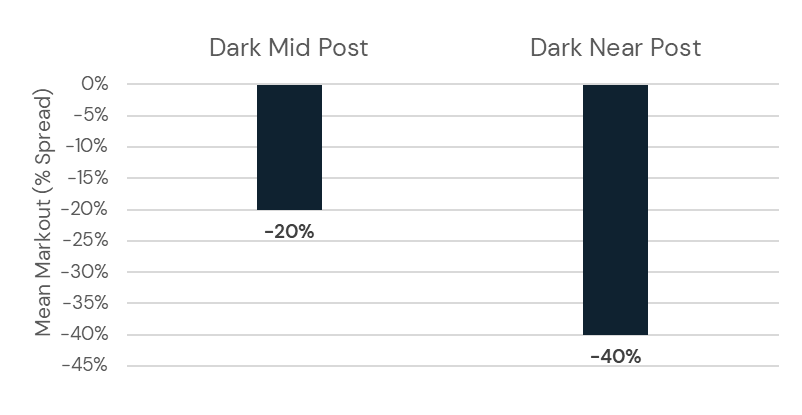
Figure 4. Mean mid-to-mid markout as a percent of spread for Dark Mid Post versus Dark Near Post child orders. Both are resting orders, but those posted at near price earn spread while those posted at midpoint earn none. Those earning spread experience greater adverse selection, but the earned spread may outweigh that cost. This tradeoff should be evaluated per venue.
However, it is important to note that this calculation must be done for each venue. At some venues, near posting works despite the toxicity. At others, the adverse selection is so severe that even full spread capture cannot compensate for it. Analytics are required to know which is which.
3.3 Minimum Quantity as a Filter
There is one more lever to pull that can help make posting more profitable (or less toxic, rather), and that lever is minimum quantity specification.
Toxic flow checking dark pools before sweeping exchanges has a signature—it is small and urgent. Size alone can distinguish a 200-share ping from an SOR from a 10,000-share fill from an institutional counterparty, and minimum quantity filters exploit this. By requiring a minimum fill size, an order can limit trading to legitimate block flow while letting the exchange-destined pings pass through without touching it.
Curator's smart minimum quantity filter takes into account the average trade size, average depth of book, stock price and volume of an individual stock as it blocks over 99% of exchange-destined flow. The small portion that gets through Curator’s filter has markouts similar to those of natural block flow, meaning that toxic pingers do not reach these resting orders.
But there is a bit of nuance to minimum quantity specifications: the right minimum depends on whether an order is taking or providing liquidity.
When taking (pinging), an order will trade against passive providers that are inherently less toxic, as discussed above. In this case, a lower minimum quantity setting is appropriate as the trader wants the fill.
When providing (posting) at midpoint, however, an order faces both adverse selection and information leakage, and higher minimums can protect against both. With a higher minimum quantity, an order blocks toxic pingers and stops small orders from detecting its presence.
When providing (posting) at the near price, an order captures spread from small exchange exhaust, which is the whole point. Lower minimums make sense in this case, where those small urgent orders are exactly the flow the order intends to attract.
Critically, tactic selection is not simply a choice of which is best, but rather a thoughtful layering of all available options, as market conditions dictate what liquidity is available at any given time.
Here, we will point out as in the introduction, that conditional orders are a special type of tactic for engaging with dark liquidity and they require focused attention for optimizing performance and limiting the effects of adverse selection and, most importantly, information leakage. This topic requires more than a section in this paper, rather it will have its own focus in a second release on dark liquidity curation via conditional orders.
Curator layers each of the tactics described above simultaneously, each with distinct minimum quantity settings, calibrated based on what the data shows is working. In addition, Curator optimizes across tactics in real time, continuously adjusting based on parent order urgency and market conditions.
4. Segmentation Using Signals
In the sections above, we introduced options for segmentation that filter toxicity based on the counterparty or on counterparty characteristics such as markouts. These methods have focused on group-level decisions that would include or exclude all executions of a specified type. In this section, we introduce an option that would exclude a subset of executions in real-time based on market characteristics at order placement time.
Proprietary signals can be developed based on market conditions that can inform order placement or execution (in the case of firming up to conditional invitations). They can be used alone or in conjunction with any of the options described in preceding sections and tuned throughout the lifetime of a parent order depending on its progress. Signals are where venue-provided protections end and broker-level innovation begins.
4.1 The Signal Concept
Some venues, such as IEX, use proprietary signals (e.g., IEX’s Crumbling Quote Indicator) to protect their resting orders. BestEx Research has created its own signal, Alpha, that can be applied to all executions at all venues, providing protection across the entire ATS landscape.
BestEx Research Alpha normalizes its signal values between -1 and 1, where -1 represents the worst conditions (predicting the highest adverse selection) and 1 represents the best conditions (predicting the lowest adverse selection). Using millions of executions, we measure the hypothetical markouts at each venue if all executions below various signal thresholds are disabled.
Alpha’s threshold determines how much signal filtering to apply; when the threshold is -1, the signal is disabled and when the signal is set to 0.5, for example, the algorithm will only execute during the top 25% of market conditions. However, Alpha’s signal threshold can be tuned on a continuous scale, avoiding the worst x% of executions for any value of x.
4.2 Signal Effectiveness & The Fill Rate Tradeoff
As for other filtering methodologies described above, limiting poor-quality executions with a signal does impact fill rate. The more toxic a venue’s counterparty mix, the more likely that executions will come when the signal is negative—and the more fill rate is sacrificed when using the signal.
This result is illustrated for midpoint post orders in Table 3, below. Table 3 shows that the markout improvement is dramatic as the signal threshold is increased though the fill rate sacrifice also increases. When the signal’s threshold is set to a value of 0.0, for example, markouts are improved by 69.1% on average but only 33.2% of execution opportunities are retained. Table 3 underscores the effectiveness of the signal while also warning of the fill rate tradeoff.
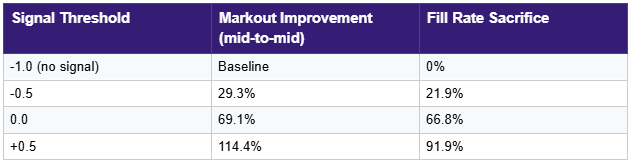
Table 3. Example mid-to-mid markout improvement and fill rate sacrifice for varying settings of BestEx Research Alpha’s signal threshold. These results are specific to midpoint post orders across venues for illustration of the effect. The signal has varied effects across tactics, as detailed below in Section 5.3.
4.3 Signal Effectiveness by Tactic
Signal effectiveness varies substantially by tactic, and signal threshold should be tuned by tactic as a result.
Near posting strategies benefit most from signals, which is highly intuitive given that these orders are most likely to be trading against taker flow as described in Section 3. Midpoint ping strategies benefit least, because they are already heavily shielded from toxic flow by design (also discussed in Section 3). These findings suggest assigning different signal thresholds for each tactic, outlined below in Table 4.
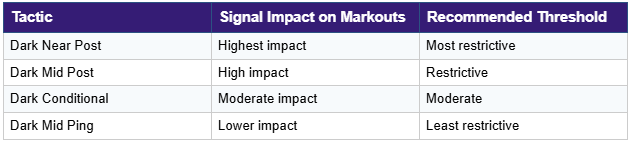
Table 4. Recommendations of signal threshold settings by tactic. As each tactic is naturally exposed to a different mix of counterparties (Section 3), some tactics benefit more from applying a signal than others.
For midpoint post orders, markouts range from about -18% of spread at unfavorable signal levels to +29% at favorable levels—a 47-point swing based purely on signal-informed timing. These orders feature the broadest range of outcomes.
Of course, when considered by venue, venue-specific effectiveness and venue-specific fill rate tradeoffs emerge as well, as a result of the distinctive mix of counterparties present in each. These results are illustrated in Section 5.2.
5. The Decision Framework: Segmentation, Tactic, or Signal?
With three layers of protection available—ATS segmentation, tactic selection, and proprietary signals—challenge lies in identifying the combination that works best for each venue and then for the overarching execution strategy. The decision framework outlined below intends to act as a flowchart for decision making.
5.1 The Core Principle
Tactics generating high-quality fills don't need segmentation or signals. Pinging with IOC orders at midpoint, for example, already limits exposure to informed, toxic taker flow, thereby reducing adverse selection. Alternatively, posting at midpoint requires careful attention and quantification because of the broad mix of potential counterparties.
5.2 Venue-Specific Results
We have developed a quantitative framework that compares, for each venue, the markouts and the fill rates under four scenarios to support decision making for each tactic. The results of our markout analysis for orders posted at the near price are illustrated in Table 5. The four scenarios we consider are:
- No protection: executes in the full pool, signals disabled
- Segmentation only: best tier only, signals disabled
- Signal only: executes in the full pool, signal enabled at threshold 0.0
- Segmentation + Signal: best tier only, signal enabled at threshold 0.0
Table 5 illustrates the execution markouts resulting from the four treatments across venues. As shown, results vary substantially by venue. For example, some venues have excellent markouts without the use of segmentation or signals. In addition, some venues need segmentation but signals add little value. In some cases, the opposite is true, with signals effective but the venue-sponsored segmentation is ineffective. And finally, some highly toxic venues need both—and even then may not reach acceptable markout thresholds.
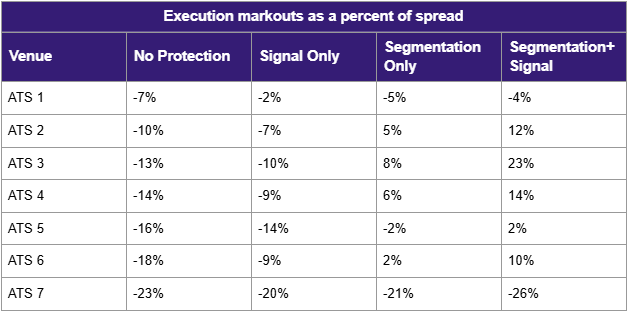
Table 5. List of anonymized venues with corresponding execution markouts for orders posted at near price in each of four samples: 1) execution in full pool, 2) execution in only top tier of pool, 3) execution in full pool only when signal is on, 4) execution only in top tier of pool when signal is on. Results of both segmentation and signal application vary by pool. ATS names in Table 5 do not correspond with ATS names in Figures 1-2.
While the results in Table 5 are promising for both segmentation’s and signal’s abilities to improve execution quality, applying either or both does reduce expected fill rates. While a child order rests in only the top tier of a pool, for example, it may never meet a counterparty qualified for execution, leaving it unfilled, canceled, or replaced by a more urgent order.
In some venues, segmentation or signal alone can be applied while retaining a moderate likelihood of fill. In some venues, applying both signal and segmentation is too restrictive, generating few fills, and a decision would be required to prioritize the most useful filter. In these cases, analytics such as those provided in Table 5 are useful.
It is important to note that the BestEx Research Alpha signal threshold can be set to any value between -1 and 1. For values of the signal threshold other than 0.0, markouts and fill rates can change substantially, creating an opportunity for a tailored approach by venue, tactic, and more.
5.3 Optimization Based on Urgency
As always, the optimal strategy configuration depends on the execution urgency and liquidity demand of a trader’s orders. For example, we would not choose a strategy with signals and segmentation limiting fill rates to 5% for high-urgency, large orders and expect good results. In that case, the execution risk incurred by a slower-to-complete algorithm would far outsize gains from reduced markouts.
In order to address the challenge of customized optimization, we are guided by the following principles:
- Set the target markout threshold based on strategy urgency
- Pick the least restrictive protection method that achieves the threshold
- Maximize fill rate subject to the markout constraint
Given these conditions, high-urgency strategies will accept worse markouts for better fill rates, making appropriate progress to limit execution risk. On the other hand, lower-urgency strategies can afford more restrictive settings given a longer execution horizon. Institutions should work with their brokers to optimize their strategies’ use of these methodologies for improved performance. We provide our “Dark Liquidity Curation Playbook” described in the next section as a guide.
6. The Dark Liquidity Curation Playbook
This section synthesizes the execution options and decision framework described throughout this paper into actionable steps. It may help to consider dark liquidity curation as operating on three levels—venue configuration, tactic selection, and measurement—each level compounding on the others. We follow the steps below as we work to optimize our clients’ execution outcomes.
6.1 Maximize Access First
There is no such thing as a toxic pool, only toxic participants within a pool. Segmentation, tactics, and signals are ways to curate liquidity within an ATS, reducing the toxicity experienced when trading there.
As a result, it is important to maximize access to ATSs and have direct connectivity so liquidity exposure within each ATS can be fine-tuned while maintaining appropriately high fill rates. Curator connects directly to ATSs representing over 97% of ATS liquidity in US equities.
6.2 Review ATS-N Filings
Prior to mandatory detailed ATS-N filings, it was difficult to understand the nuances in order types, segmentation, and information access within each ATS. Required ATS-N filings have changed the game.
The onus is on the algorithmic trading broker to understand each ATS's nuances through careful review and interviews with ATS operators, then configure ATSs to minimize information leakage and avoid toxic order flow.
6.3 Build a Quantitative Framework
Do not rely on venue-published metrics or marketing narratives. Venue-published metrics reflect aggregate performance across all participants, including HFT market makers whose markouts are better than others’ will be.
Measure markouts by venue, segment, and tactic. Measure information leakage incurred from faded conditional orders (more to come on this in our paper on optimizing conditional liquidity). Measure fill rates under different configurations. Build proprietary intelligence that feeds into algorithm design decisions.
6.4 Address Principal Flow
Most venues allow excluding flow from the ATS operator's principal desk. Broker-dealer operators have visibility into customer flow, creating potential information asymmetries. Review the configurations at each venue—some default to including principal while others exclude it by default.
6.5 Handle Locked and Crossed Markets
When the bid equals or exceeds the offer, midpoint-pegging and near-pegging orders target the same price, eliminating price improvement. These conditions also correlate with imminent price movements. Configure systems to suspend dark activity during locked and crossed market conditions.
6.6 Measurement and Iteration
Dark liquidity curation is not a one-time setup—markets evolve, venue participant mixes shift, and our clients’ flow characteristics change. It is critical to measure continuously, shifting configurations appropriately as conditions change. The following list shares some of the most helpful measures for regular review of execution quality.
- Markouts by venue, segment, and tactic at multiple time horizons (e.g., 1s, 10s, 1min)
- Fill rates by venue, segment, and tactic
- Conditional order metrics (to be detailed in our second curation paper focused exclusively on conditional orders) such as
- Invitation rate
- Firm-up rate
- Execution rate (fade rate)
- Information leakage (price movement following fades)
- Venue win rates when simultaneous invitations are received
7. The Bottom Line
The transformation of ATSs from simple block-crossing venues to complex, layered ecosystems created a challenge for those looking to curate the best available dark liquidity for their unique order flow. Firms that treat dark liquidity as a black box—connecting with default settings and hoping for the best—are leaving alpha on the table, unnecessarily absorbing major costs stemming from adverse selection and information leakage.
On the other hand, however, firms that master curation gain a meaningful competitive advantage. They configure venue segmentation to filter counterparties. They choose tactics that put them on the right side of information asymmetries. They respond in real time to changing market conditions. And they measure everything, iterating continuously as markets evolve. They follow a playbook of principles for optimizing fill quality and—perhaps most importantly—adapt as new information emerges.
Perhaps the most important takeaway here is that the fifty shades of grey in sourcing dark liquidity are not obstacles; they are opportunities for those willing to adapt and to navigate them systematically.
Appendix: ATS Segmentation Reference
Table 9 below provides a summary of segmentation options at major US equity ATSs. However, users should verify current configurations with venues directly.
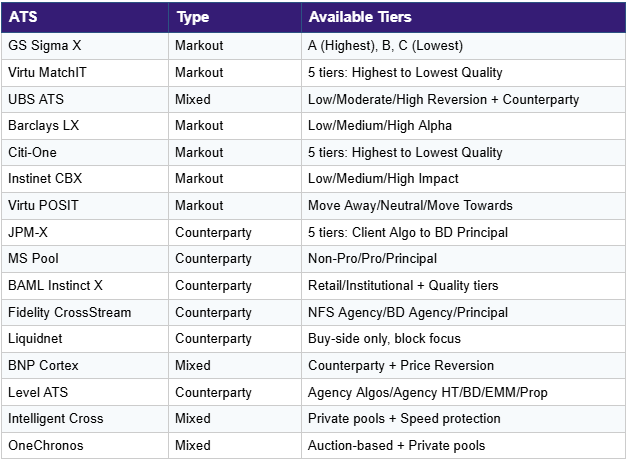
Table 9. Summary of ATS segmentation types and available tiers, highly distinctive across venues.
At BestEx Research, we care how you fill. We know from experience that systematic, quantitative decision-making around algorithm design contributes to globally optimal execution and results in significantly reduced execution costs.
Reach out to us with questions at research@bestexresearch.com or learn more about us at bestexresearch.com.
This research paper reflects the views and opinions of BestEx Research Group LLC. It does not constitute legal, tax, investment, financial, or other professional advice. Nothing contained herein constitutes a solicitation, recommendation, endorsement, or offer to buy or sell securities, futures, or other financial instruments or to engage in financial strategies which may include algorithms. This material may not be a comprehensive or complete statement of the matters discussed herein. Nothing in this paper is a guarantee or assurance that any particular algorithmic solution fits you, or that you will benefit from it. You should consider whether our research is suitable for your particular circumstances and needs and, if appropriate, seek professional advice.
ATS segmentation information is based on publicly available Form ATS-N filings and is subject to change. Users should verify current configurations directly with venues. Past performance data does not guarantee future results.